![World Whiskey Day (May 18) Cocktail Recipes [COCKTAIL TIME]](https://i0.wp.com/luxebeatmag.com/wp-content/uploads/2024/05/World-Whiskey-Day-e1714592315699.png?resize=440%2C264&ssl=1)


How Candlestick Charts Improve Decision-Making in Commodity Trading

The world of commodity trading is both complex and challenging, and it demands a broad understanding of various technical tools to make informed decisions. One of the critical tools that have emerged in recent years is the candle stick chart. This simple yet powerful tool has revolutionized the way traders analyze and interpret market trends. This article delves into candlestick chart technology and how it can improve decision-making in commodity trading.
The Power of Candlestick Charts
The introduction of candlestick charts to commodity trading has provided a new perspective on analyzing market trends. The charts offer visual cues that make it easier to identify trading patterns and price movements at a glance. This enhanced visualization aids in quicker decision-making, potentially leading to enhanced returns.
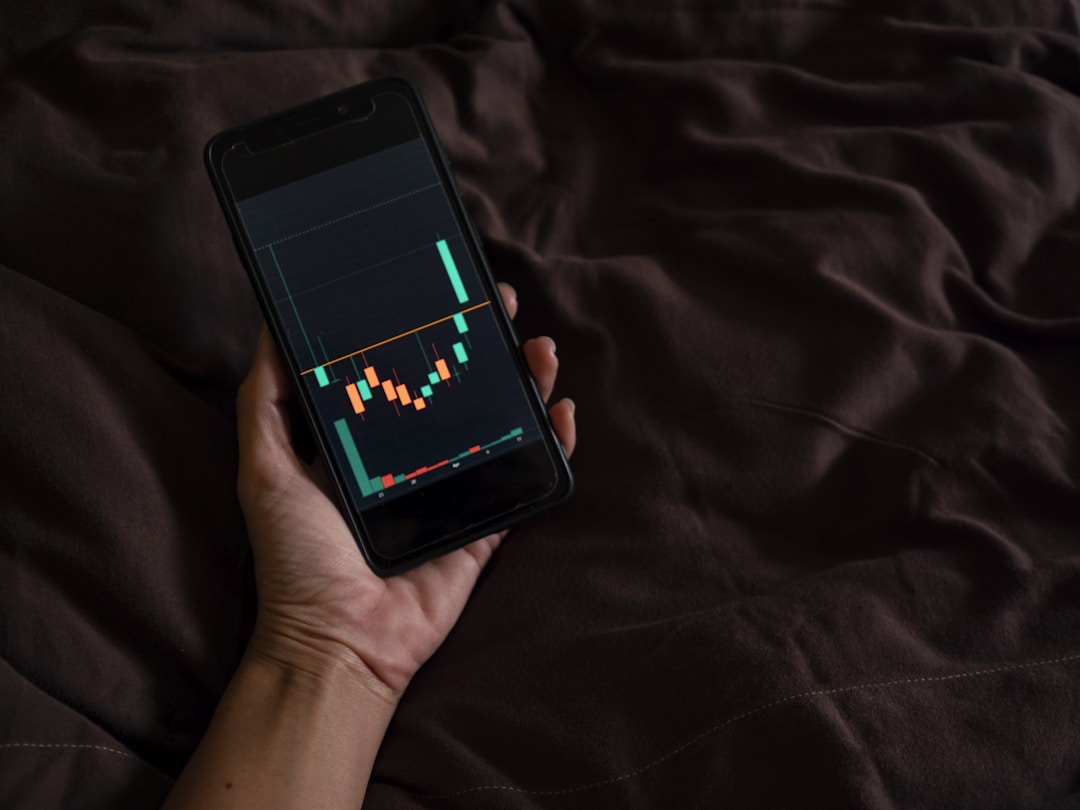
Unlike line or bar charts, candlestick charts give a fuller picture of market activity within a specific timeframe. They display four major price points—the opening, closing, high, and low prices. This level of detail gives traders a deeper understanding of market sentiments, bolstering their ability to predict future price movements more accurately
Candle charts also excel in revealing reversal patterns—pivotal moments when price trends change direction. Being able to identify these patterns in real time can be a game-changer when it comes to capitalizing on profit-making opportunities or mitigating losses in volatile markets.
Understanding Candlestick Patterns for Effective Analysis
There are dozens of candlestick patterns that traders need to recognize for efficient trading. Each pattern tells a unique story about the current state of the market, offering insights that can reveal profitable trading opportunities. Learning and understanding these patterns will significantly enhance a trader’s ability to make informed decisions, leading to better results.
Among the significant patterns are bullish and bearish engulfing patterns, doji patterns, and hanging man patterns. Their analysis can tell traders if a trend is about to start, continue, or if a reversal is imminent. Being able to read these patterns and incorporate their implications into trading strategies can be the difference between making a profit and taking a loss.
Here, education is vital. Traders must invest in learning how to interpret chart patterns correctly. Resources are abundant, with many online platforms offering in-depth courses and resources on candlestick pattern analysis.
Applying Candlestick Patterns in Trading Strategies
Candlestick charts not only provide an understanding of market trends but also allow traders to apply the insights derived from them directly into their trading strategies. Candlestick pattern recognition and analysis can add tremendous value to various trading strategies, enhancing their effectiveness and increasing the potential for high returns.
Whether a trader is involved in day trading, swing trading, or long-term investment, candlestick charts can serve to improve their approach to market entry and exit. The more acquainted a trader is with the specific signals and patterns that candlesticks offer, the better they’re equipped to react to rapid market changes.
Using the detailed information provided by the candlestick charts about open, close, high, and low prices, traders can develop robust strategies that balance risk and reward effectively. The predictive value of candlestick patterns allows traders to anticipate and respond strategically to market dips and hikes. This capacity to plan and execute strategies based on pattern analysis can often be the difference between a good and an excellent trader.
The User-Friendliness of Candlestick Charts
Complexity is an inherent aspect of trading, particularly in the fast-moving world of commodity trading. However, candlestick charts simplify this complexity by providing an intuitive visual representation of market trends. They’re easy to read, with clear graphical illustrations of price fluctuations, making them user-friendly even for novice traders.
The actual implementation of candlestick charts is relatively straightforward. Most trading and charting software has built-in features that allow you to switch to candlestick mode, eliminating the need for manual plotting. The ease of use, combined with the wealth of information they offer, make candle charts an indispensable tool for modern traders.
It’s not just about simplicity, the vibrant nature of candlestick charts also makes market analysis engaging and enjoyable, encouraging traders to spend more time understanding market trends and, consequently, making better trading decisions.
Overall, if there’s one tool that encapsulates the convergence of tradition and innovation in the world of trading, it’s the powerful and ever-relevant candlestick chart. Mastering its usage could amplify the potential for success in the challenging yet rewarding world of commodity trading.


